Diagnose fracture geometry during simul-frac operations
Permian Basin
In unconventional shale, operators want to maximize return on capital, improve cash flow, and meet well performance expectations. However, many completions are executed with limited measurements, resulting in high uncertainty and variability around which benches to develop, the impact of well interference, how to infill around existing wells, and ultimately, what design changes are required to maintain performance and operational efficiency.
The historical approach to answering these challenges consists of indirect subsurface measurements that lead to decisions based on uncertainty or a drawn-out process across numerous wells to effectively evaluate and validate performance. The result is the inability to quickly validate a treatment designs impact on fracture placement and productivity.
Fracture programs are often compared to a factory in which horsepower at the surface drives recovery and returns. As E&P companies look for avenues to maximize recovery and reduce completion costs from both parent and child wells, they are utilizing a variety of completion and asset development strategies, including the implementation of simul-frac operations.
Maximizing recovery in this environment requires understanding fracture behaviors across multiple benches and between wells. In modern manufacturing, real-time optimization adjust production processes based on realtime data. This helps factories improve efficiency, reduce downtime, and increase productivity. So why should it be any different with fracture operations?
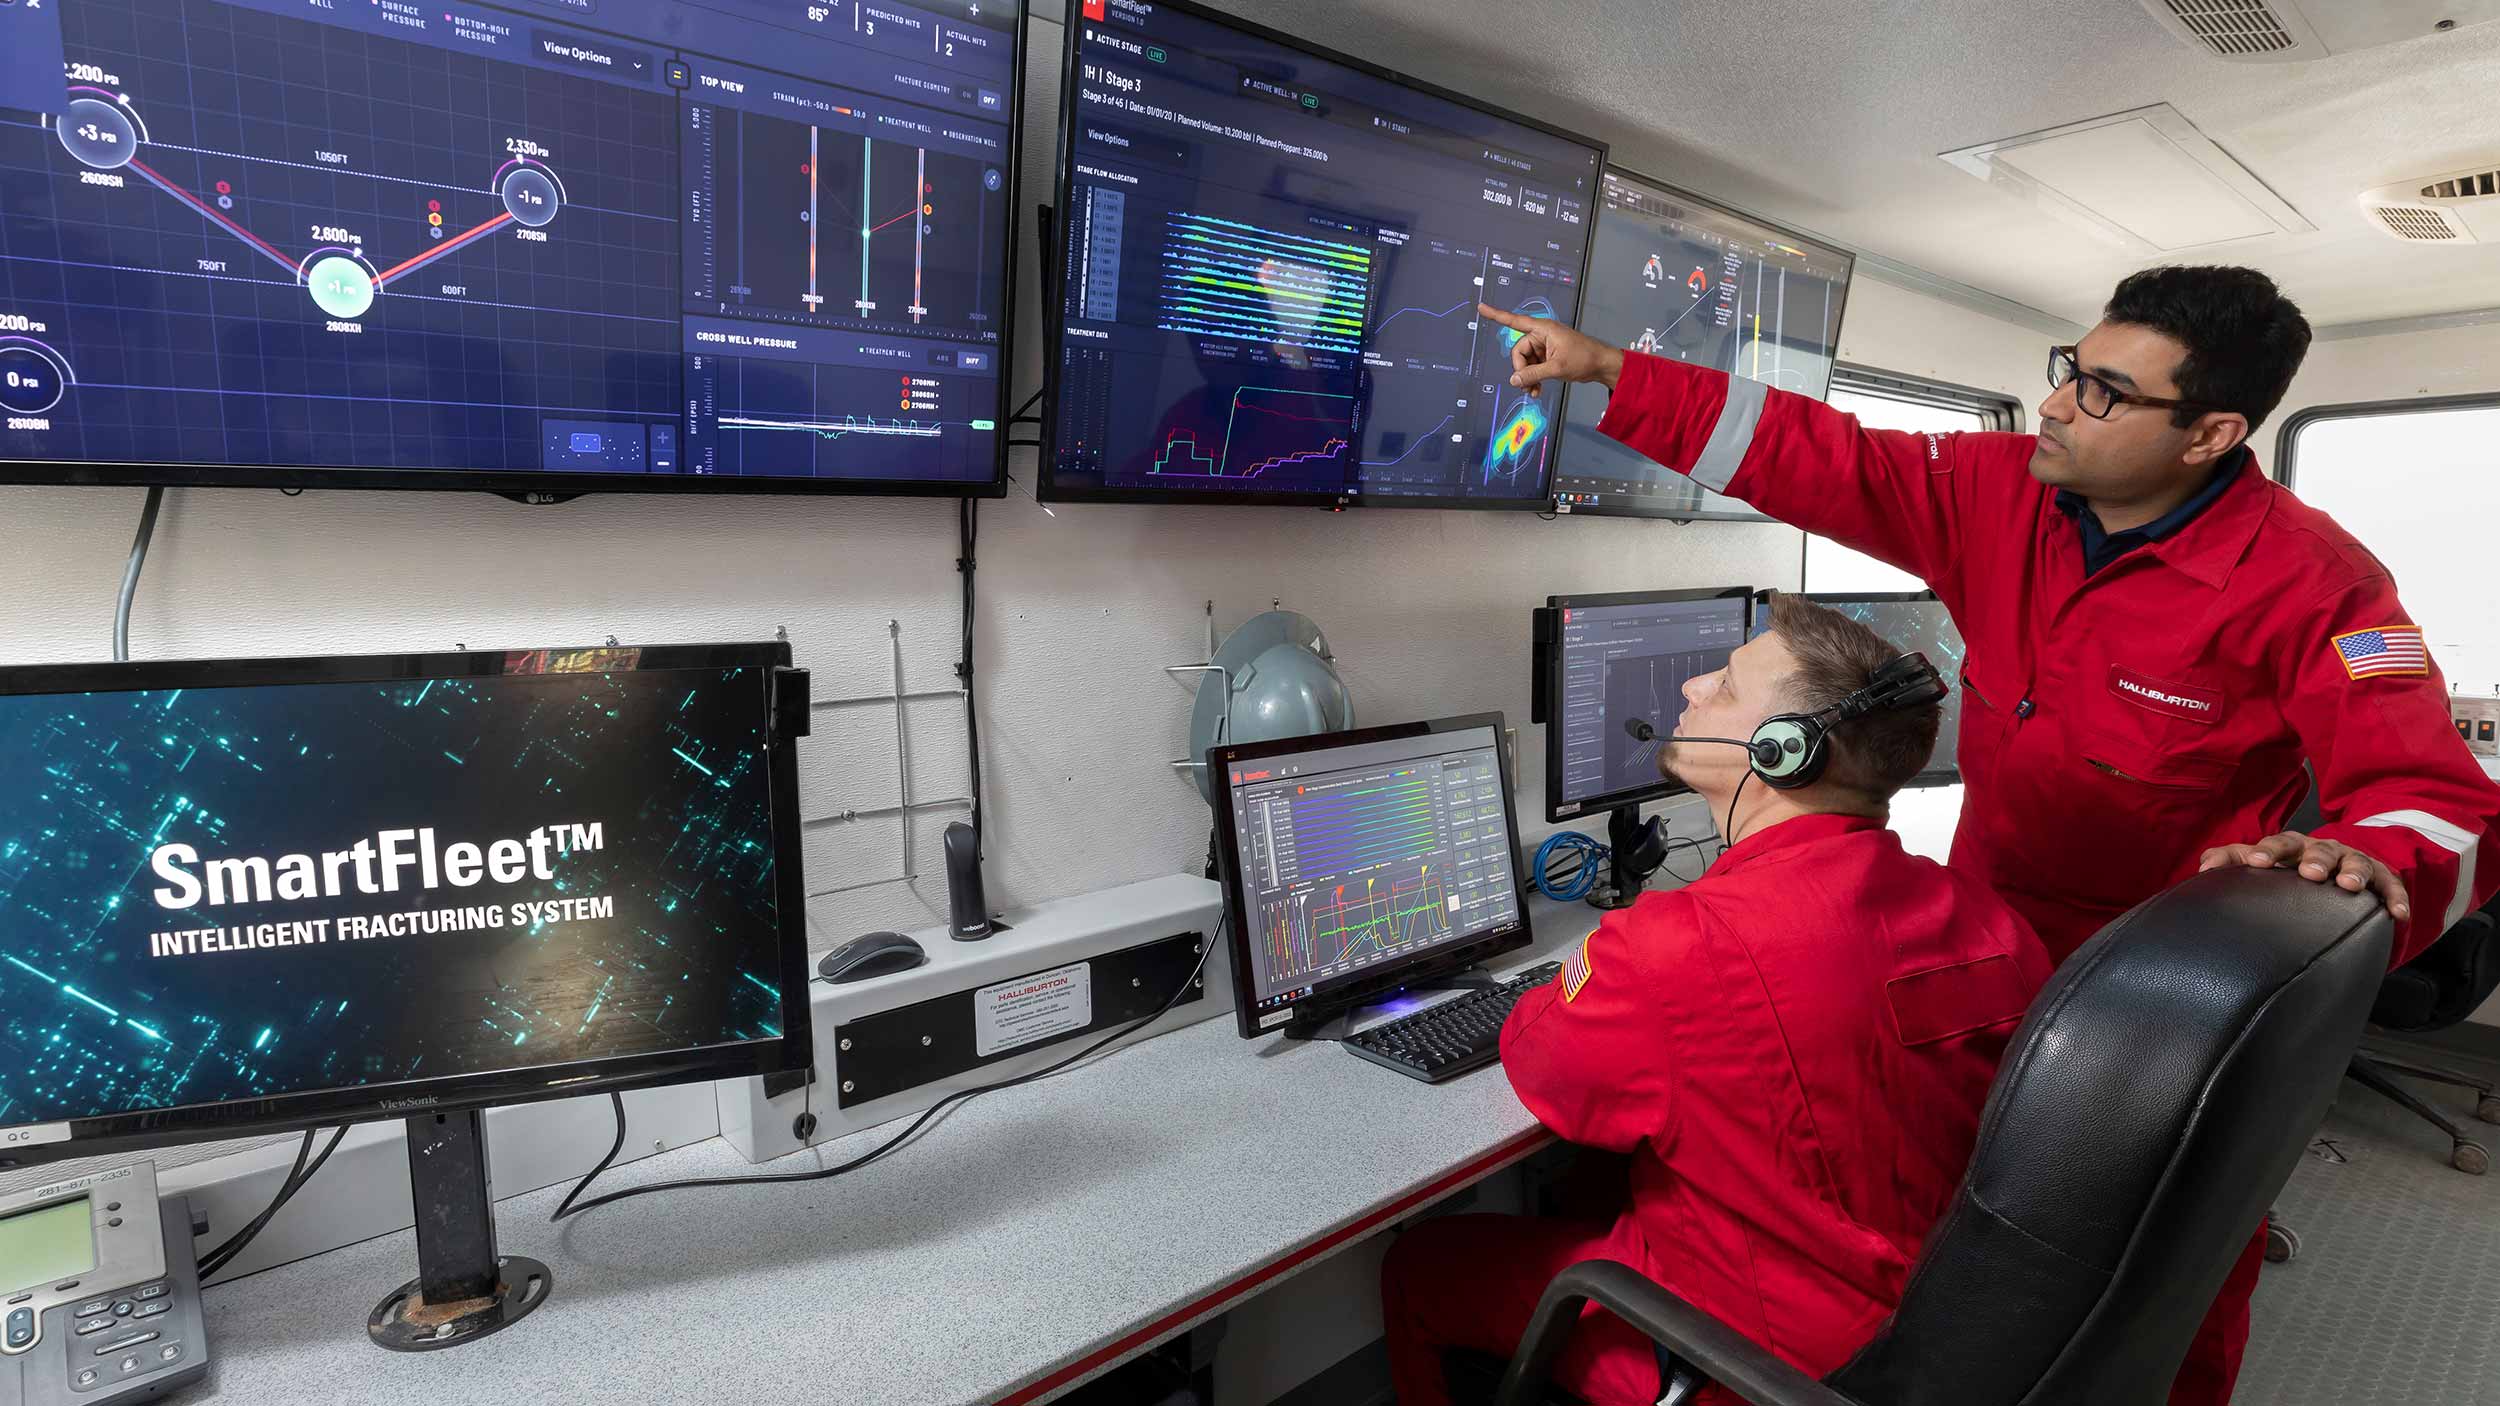
A recent example is the use of SmartFleet fracture monitoring system by an operator in the Permian Basin, where diagnosing fracture geometry during simul-frac operations is challenging given the numerous bedding planes, barriers, and other heterogeneities. Using disposable fiber optic sensors, the SmartFleet system measured the far-field fracture-induced strain and microseismic activity.
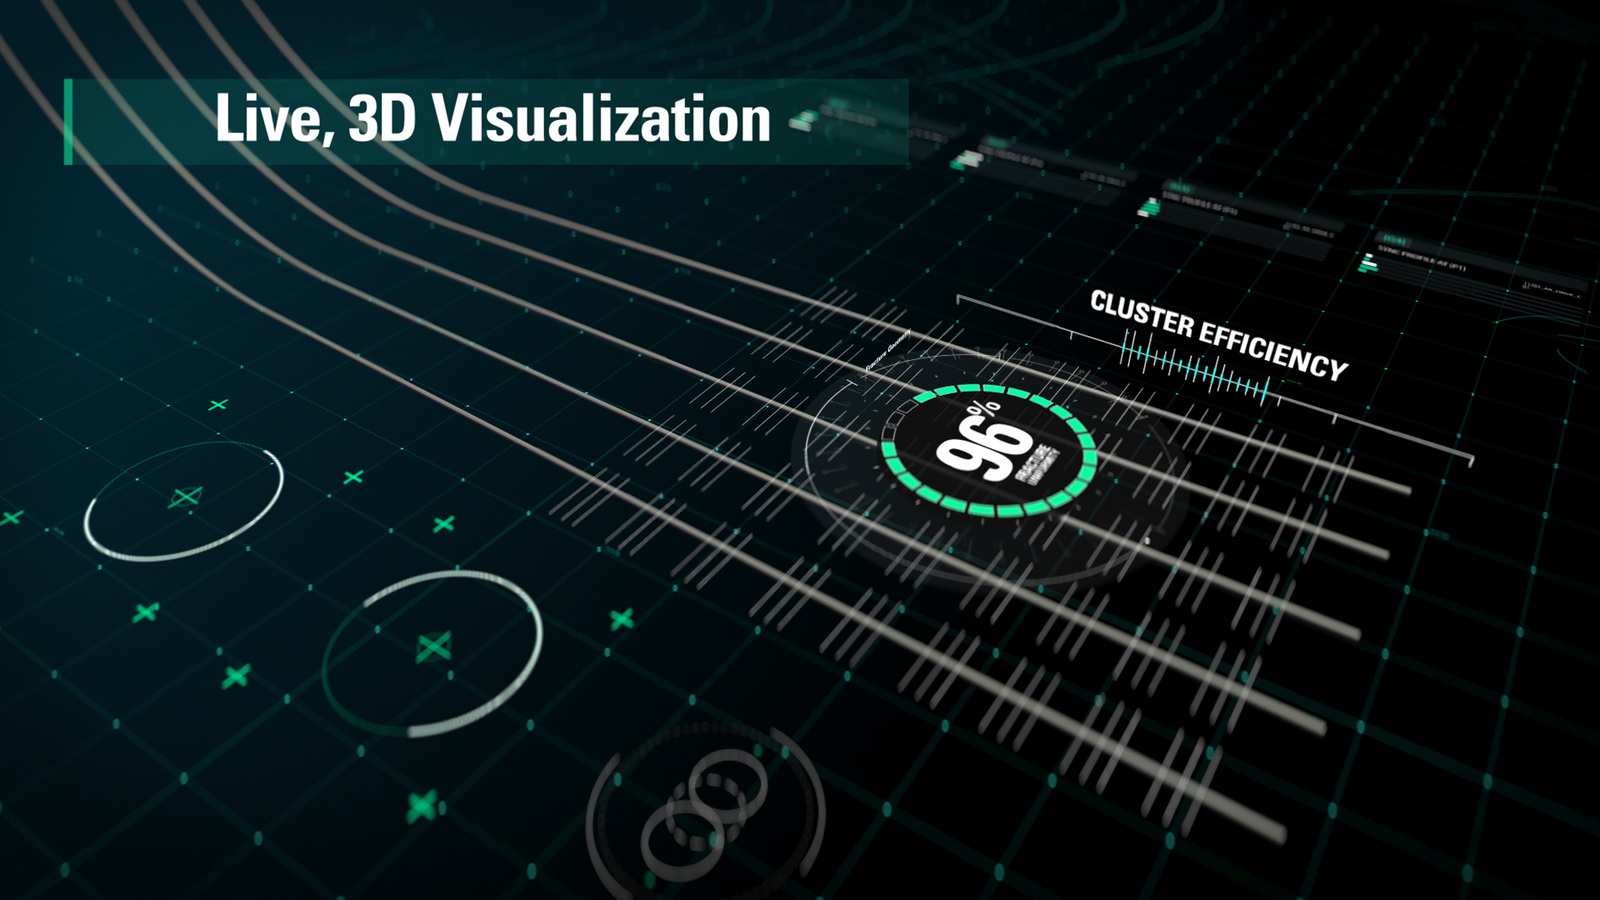
With the SmartFleet system, you can see, measure, and act on subsurface fracture behavior easier and faster than ever before. It combines downhole sensors, measurements, and visualization into a single fracture monitoring system that lets you validate fracture performance through real-time subsurface visualization and evaluation.
The monitoring system provides direct measurements and visualization of fluid distribution along the near wellbore and interactions with offset wells. With live, 3D visualization of fracture behavior, operators observe fracture azimuth, growth rate, and geometry, able to identify inter-stage communication, understand pre-frac well integrity, and evaluate well interference across benches—all in real-time.
These real-time insights drive design improvements, such as adjusting stage length while maintaining uniformity, optimizing perf designs, improving time to rate and breakdown, improving proppant schedules to reduce pump time, and identifying impacts of well sequencing.
Distributed fiber optic sensing is one of the most trusted fracture monitoring technologies for evaluating fracture performance and well interactions. However, interpreting the amount of data can be overwhelming and timeconsuming, especially during simul-frac operations. Offering design flexibility, quality data, and the ability to visualize real-time insights on a pad level makes the SmartFleet system uniquely capable of solving this problem.
During the project, the data collected in real-time is used to diagnose several completion techniques to differentiate how fracture geometry was affected by changes in completion design. The tests included changes in perforation friction, cluster count, slurry volume, and simul-frac operations.
The fiber measurements were recorded for more than 23 days, and the diagnostic results were corroborated with geochemical data and a microseismical dataset acquired with conventional geophone technology. The operator was able to validate which simul-frac treatments were communicating with observation wells and determine how the total treatment fluid volume influenced fracture growth and communication to offset wells.
Several important discoveries were defined. The gross fracture geometry propagated three times faster through the Wolfcamp B formation compared to the Wolfcamp A. A direct quantitative relationship was measured between the total volume pumped and offset wells’ resulting increased strain events. The difference in volume to first response (VFR) between simultaneously treating two wellbores versus a single wellbore was recorded, showing that simul-frac affects fracture behavior and geometry.
Fracture Monitoring Simplified
With live visualization of fracture behavior, operators can observe fracture azimuth, growth rate, and geometry to identify inter-stage communication, understand pre-frac well integrity, and evaluate well interference across benches—all in real time.
Discover SmartFleet