Measure, visualize and act on fracture behavior in real time
Download PDFValidate frac design effectiveness, uniformity and well interactions

The Bakken Formation, North Dakota

In a recent project in the Bakken, an operator selected the SmartFleet® fracture monitoring system to maximize their subsurface understanding.
This is the largest SmartFleet project to date, including six fiber optic monitoring wells, on a single pad. This was a subsequent pad in a series of projects, all with the mission of achieving faster validation, decisions, and optimization to maximize the value of every dollar spent.
There were two frac design philosophies in mind for the project, and the operator selected SmartFleet to test and validate the most effective method. They wanted to understand effective drainage by examining the effect completions had on the reservoir. The operator wanted to understand the effects of micro-proppants in the far-field, as well as the impact of increasing well entry points. They also wanted to understand heel/toe effects on completions.
There isn’t really an established way to conduct a drainage test. The closest being production shut-in and interference tests, but these tests limit you to the use of surface flow meters because they are an endpoint measurement. Surface flow meters struggle in providing accurate measurement of mutli-phase flow, which allow for warmback analysis that provides insight on the contribution from each cluster.
Production studies are another method for analyzing different design changes, but one downfall is that they ignore system effects and well interactions. Without the understanding of well interactions it’s difficult to characterize the sections contributing to final production.
Finally, there are pressure gauges, commonly used for in-treatment diagnostics. As an independent measurement source, pressure gauges provide insight on the first interaction between wells with high accuracy. However, any subsequent interaction is circumspect.
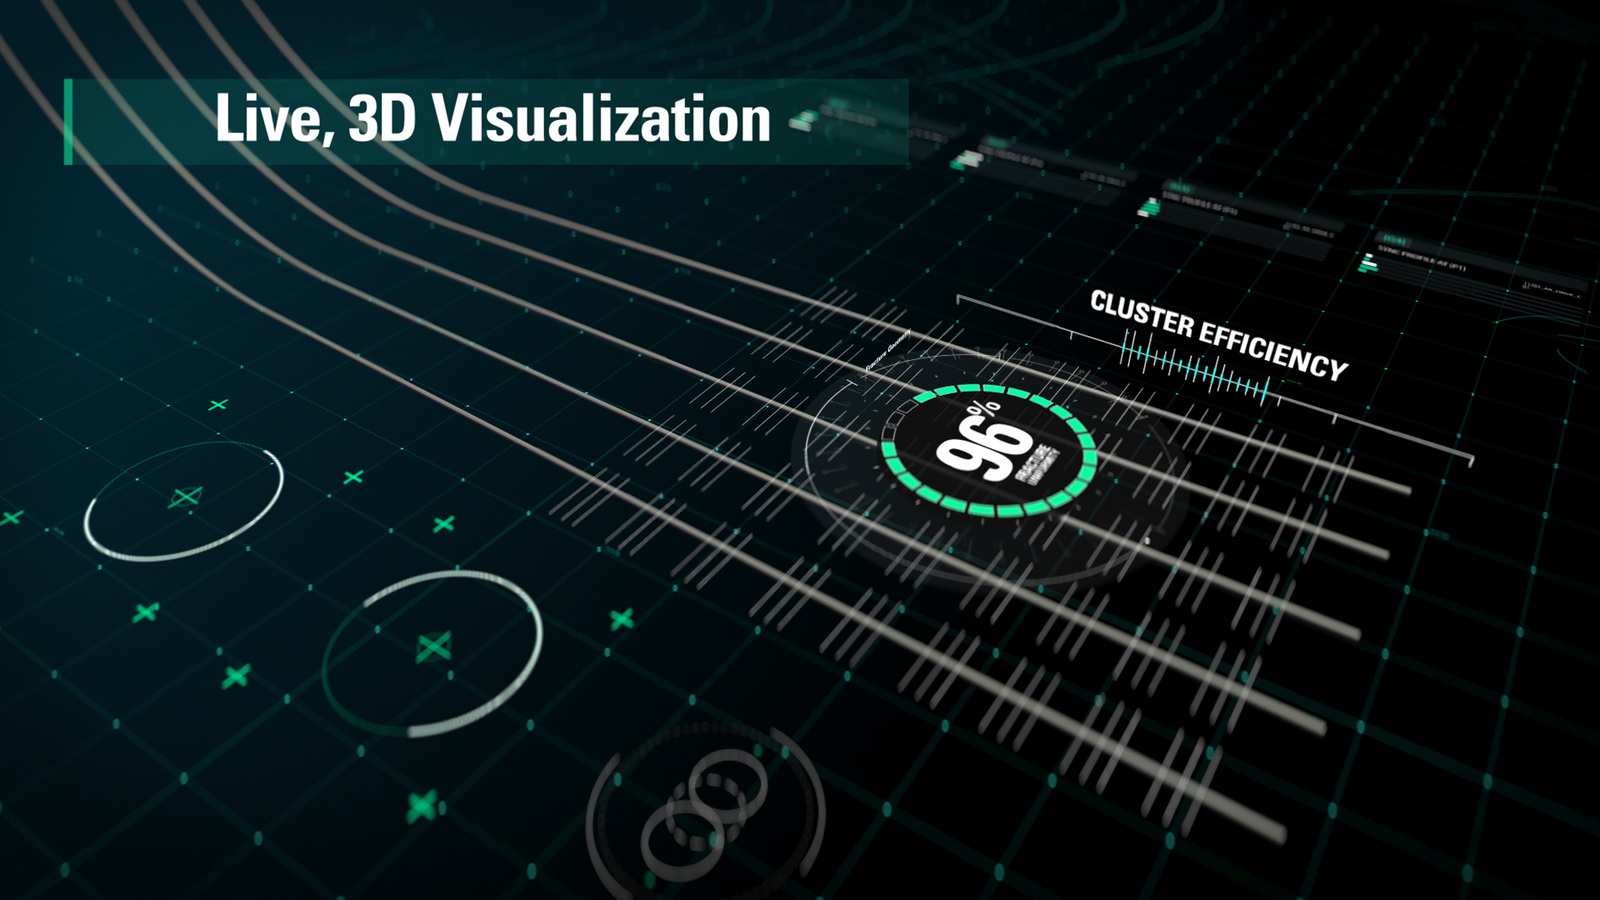
With SmartFleet, you can see, measure and act on what’s happening in the subsurface. The SmartFleet system keeps you connected to the subsurface through real-time fracture measurements and live 3D visualization, allowing you to take real-time actions that optimize completions.
Through our latest scalable fiber optic monitoring services, SmartFleet interprets fracture performance by applying direct measurements of fluid distribution along the near wellbore, as well as interactions with offset wells. SmartFleet also provides real-time, 3D visualization of all critical subsurface measurements while pumping.
For the operator, SmartFleet would allow them to further understand how their decisions impact operations, from near wellbore uniformity to cross-well interactions.
We began the project by developing a structured design of execution to limit creep. Using decision trees, we prioritized the fiber measurements taking place, placing emphasis on maintaining uniformity near the wellbore and morphology effects. Having this quantifiable measurement would allow the operator to compare the performance across each experiment tested.
The six fiber wells were primarily focused on analyzing frac hits and hit types, which provided the operator with insight on whether it was a direct frac hit, an approaching frac, or a reactivation of a previous stage.
Permanent fiber enabled the measurement of cluster uniformity and offset measurements. These measurements were a priority for the customer, in that no design changes could take place that would sacrifice the uniformity of a pumped stage. However, these measurements were also used to optimize the proppant schedule, enabling them to improve and maintain optimal uniformity.
We also complimented the fiber measurements with downhole pressure gauges. These enabled the real-time monitoring of pressure response at multiple points along the observation well, as well as future production observations. Combined, the operator could observe the effects of stress shadowing, why it occurred, and the progression across the pad. Gauges allowed them to observe a wave effect along the wellbore as we hit it from offset fracs, something that couldn’t be seen otherwise.
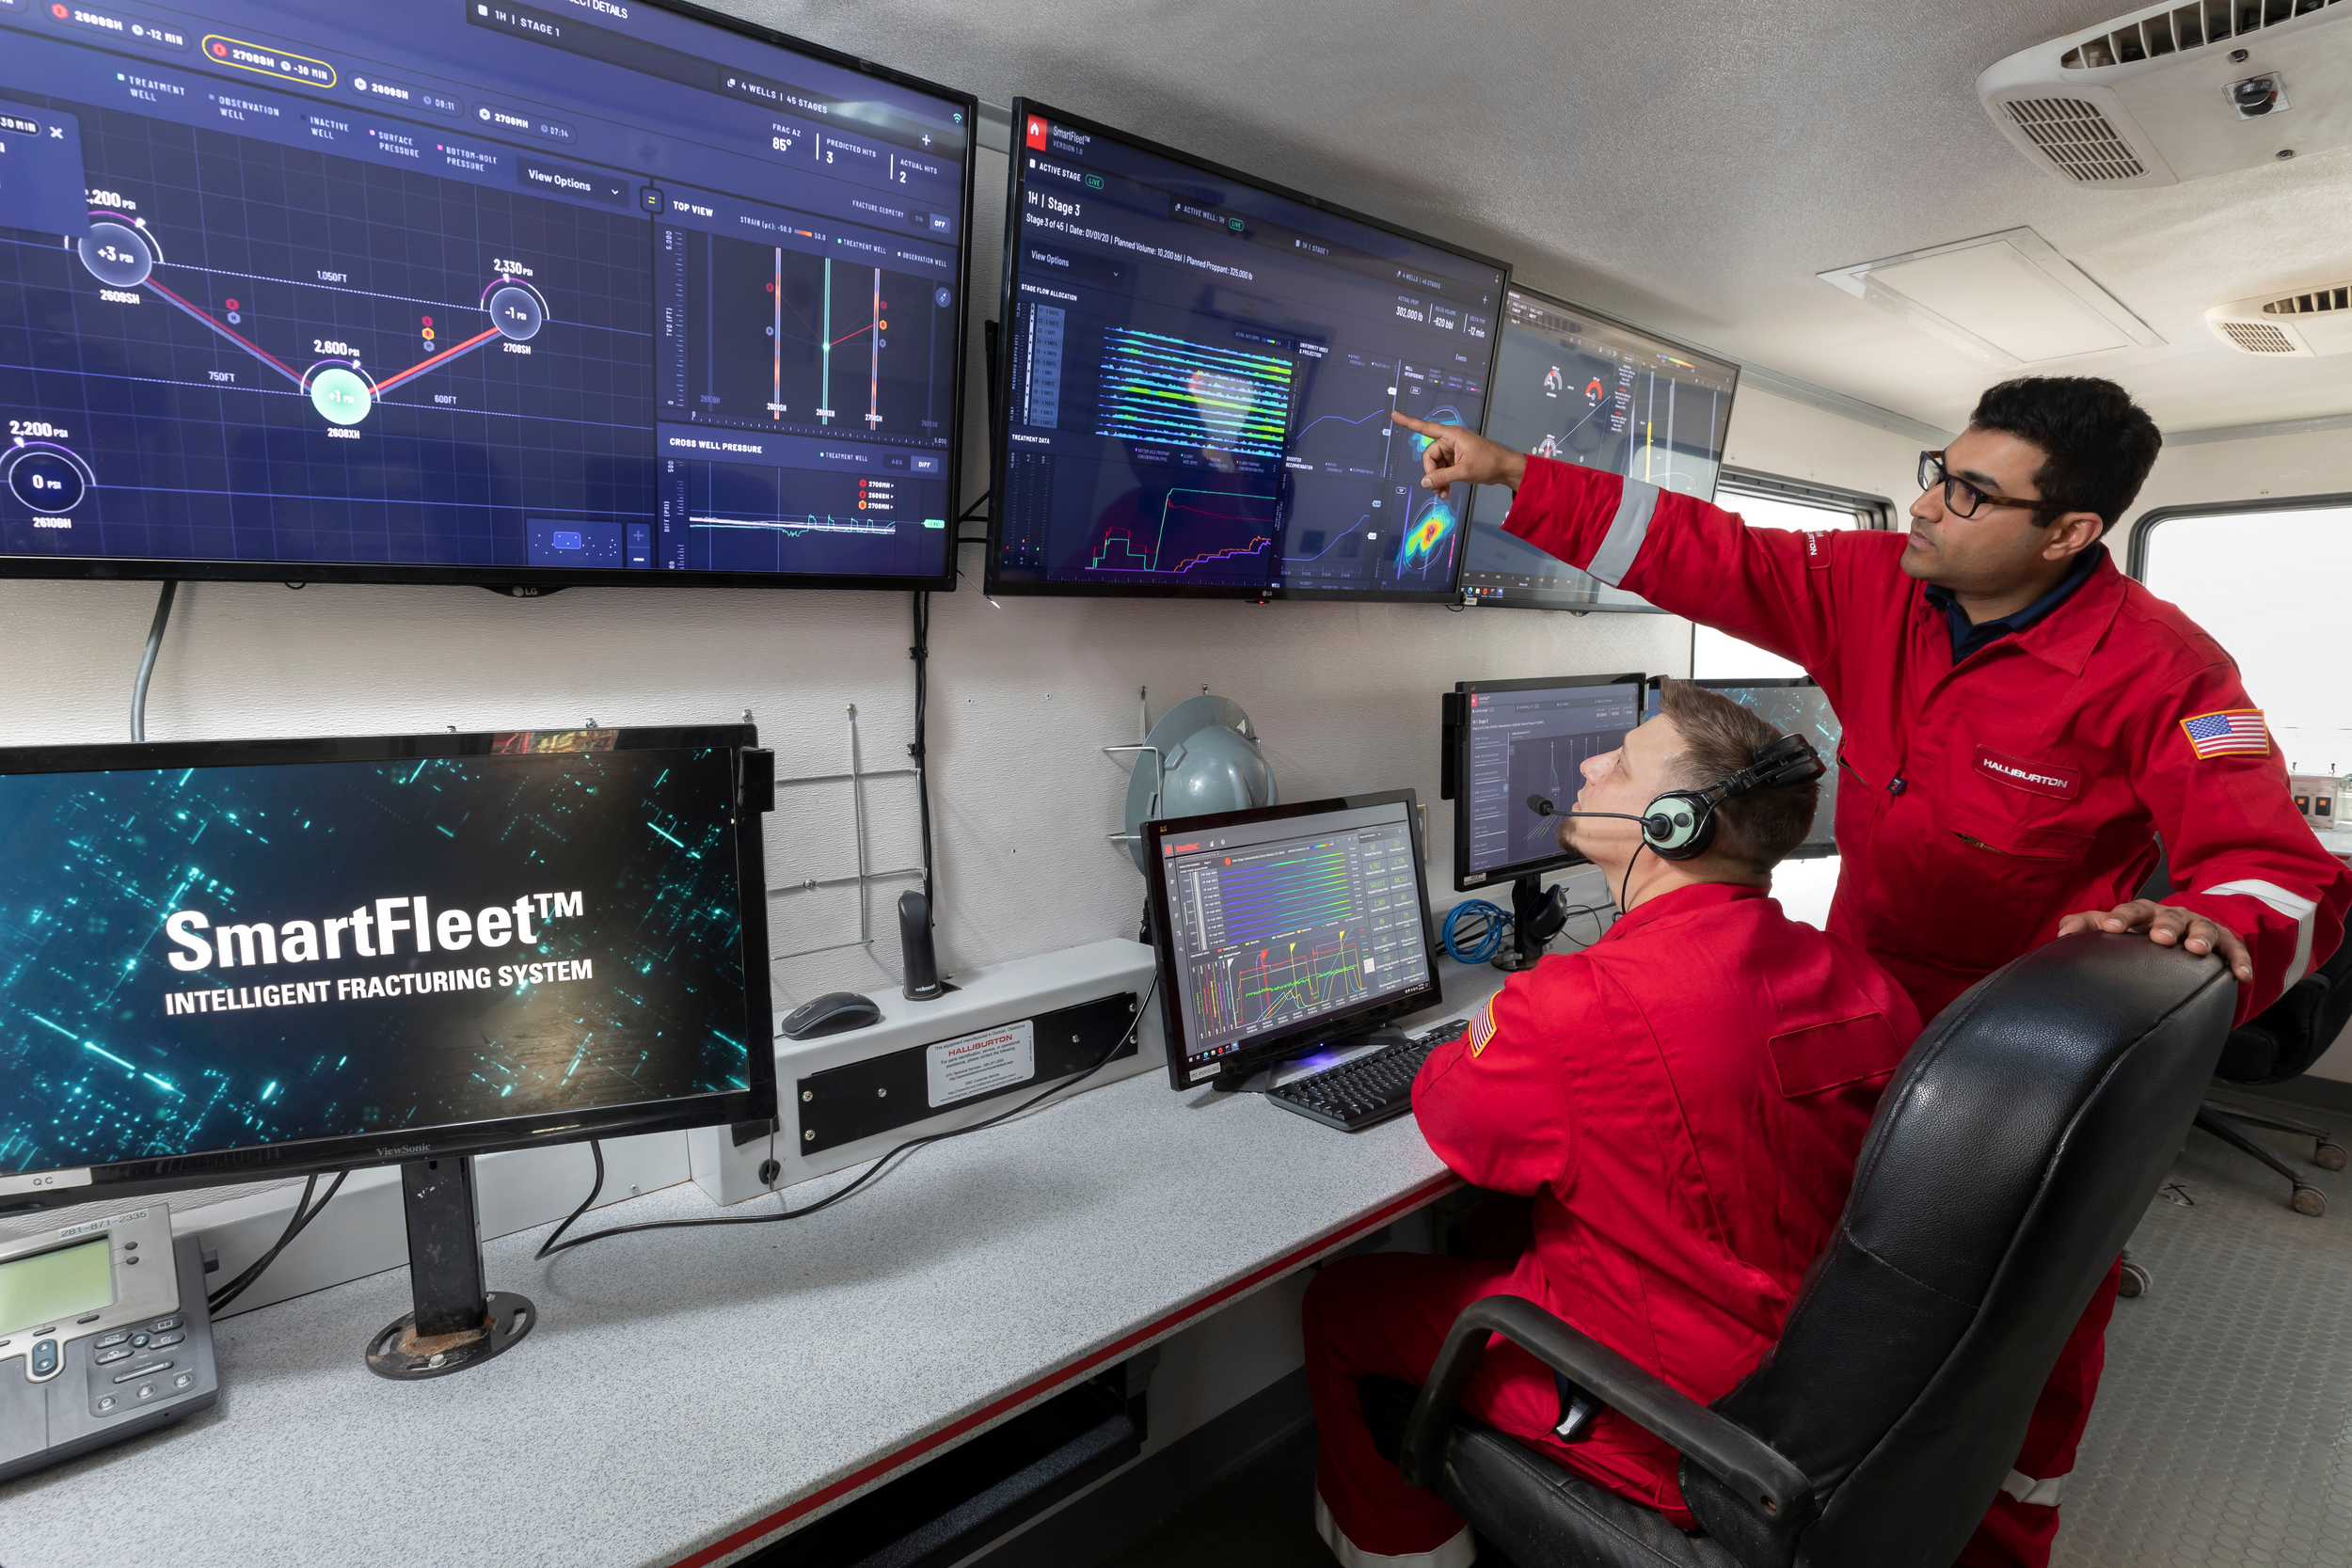
During stimulation, you want every stage to count, but without the right technology downhole, it’s difficult to understand how effective your frac program really is. With SmartFleet, our customer was able to see, measure and act on the performance of their frac treatments in real time. This allowed them to quickly evaluate two different frac designs, understand their impact on drainage, maintain uniformity and optimize design changes to maximize asset value.
Advanced Fracture Monitoring
The SmartFleet system keeps you connected to the subsurface through real-time fracture measurements and live visualization, allowing you to validate fracture performance easier and faster.