Digital and physical core analysis improves confidence in relative permeability for a complex chalk reservoir
Download PDFUnconventional

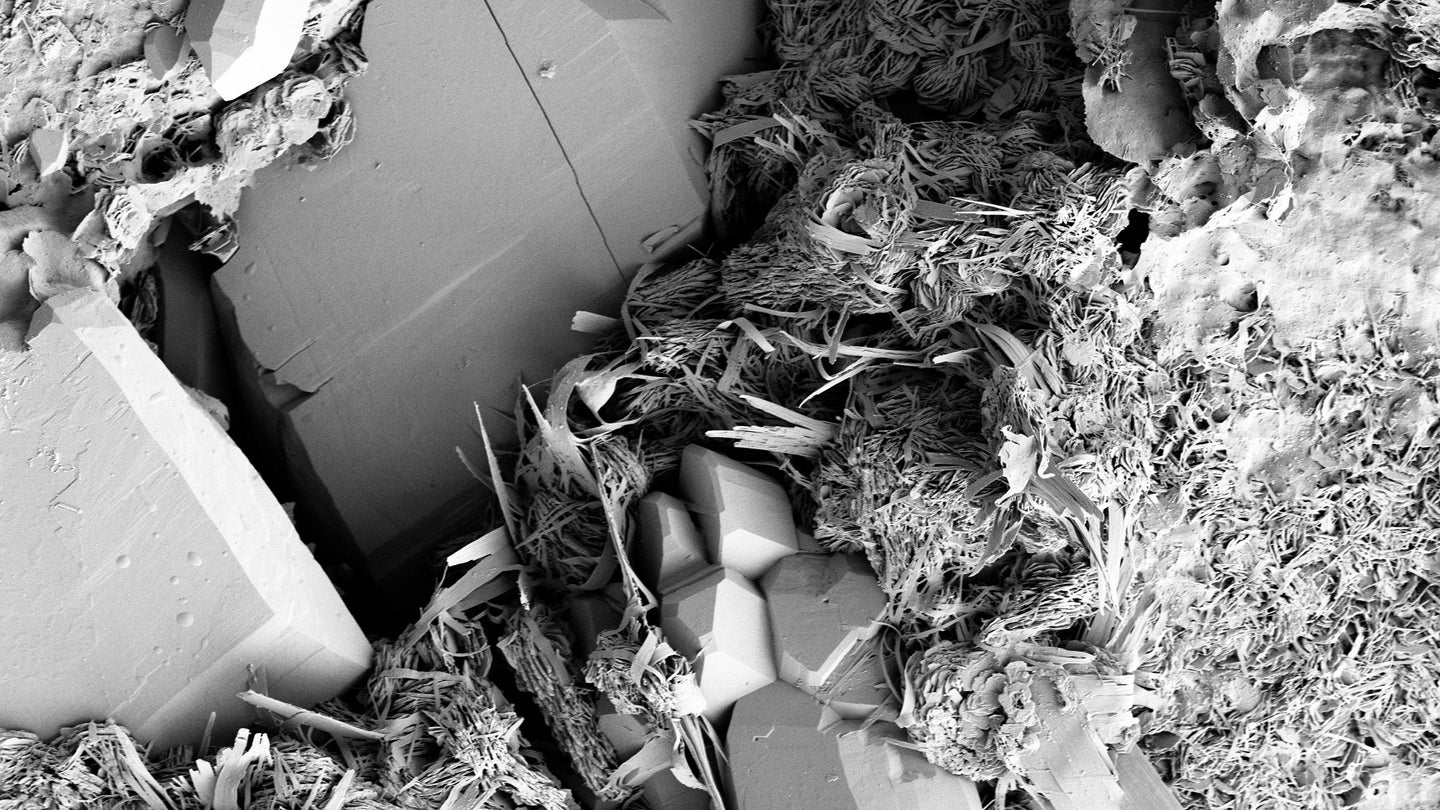
Heterogeneous chalk with high porosity and low permeability
North Sea

A North Sea operator and Halliburton collaborated to evaluate the relative permeability (Kr) of the Hod formation in the Valhall field, a mature chalk reservoir in the Norwegian North Sea. The Hod formation, though less developed than the overlying Tor formation, holds significant untapped potential. However, its heterogeneity and low permeability posed challenges for traditional core analysis workflows.
To address these issues, the team implemented an integrated approach that combined physical steady-state Special Core Analysis (SCAL) with digital rock physics (DRP). This integrated strategy allowed for early delivery of key reservoir properties and provided a robust framework to reduce subsurface uncertainty.
The Hod formation exhibited complex heterogeneity, which included brecciated and cemented features that complicated core preparation and testing. Traditional SCAL methods, particularly steady-state relative permeability measurements, proved time-consuming and sensitive to sample quality and wettability conditions.
Additionally, the nano-scale pore environment of chalk made it difficult to obtain representative flow data. These limitations threatened the ability to generate reliable Kr curves in time to support a revised depletion plan for the field.
To overcome these challenges, the team implemented a comprehensive workflow that included:
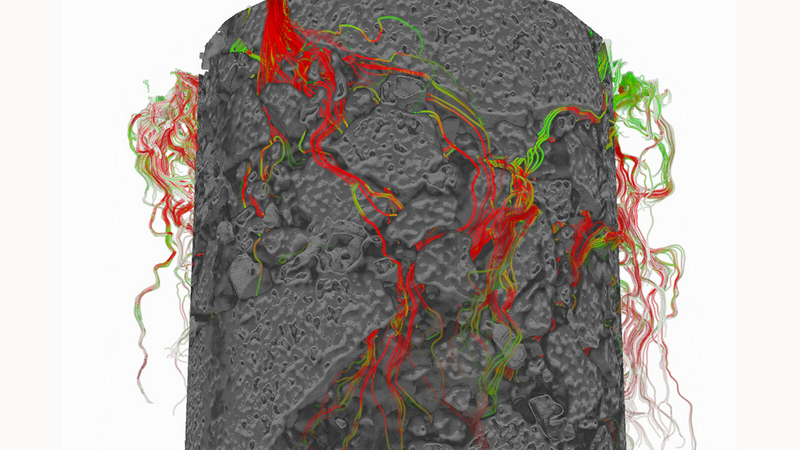
Experiments in ISSM
Digital rock volume images in high resolution
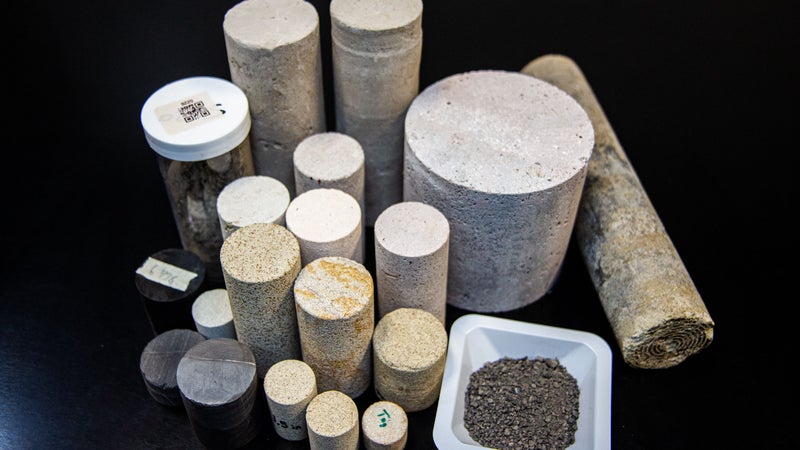
Digital and physical measurements
Insight allowed operator to improve accuracy of models
The digital SCAL workflow delivered a complete set of relative permeability curves approximately one year ahead of the physical lab results. The digital and physical Kr curves showed strong agreement, particularly for oil-relative permeability in underwater-wet conditions. This early insight allowed the operator to confirm the viability of water injection in the Hod formation, improve the accuracy of dynamic reservoir models, and reduce uncertainty in residual oil saturation estimates.
Integrated rock analysis provides the link between downhole measurements and physical properties of the reservoir, including those that control fluid flow.
Reduce uncertainty and turnaround time for estimations of hydrocarbons in place using fast capillary pressure and resistivity index relationship services